HeatmapUTC day, from the daily closes
$23M of whale positions liquidated as 84 of 100 markets fell on 29 Oct, 96% longs.
The largest: Placid Rime lost $9M of its ETH long to liquidation.
102 markets by whale money
62 more markets
Price move from 1% to 8% and more, either way2.1%price on the dayOne block: $500K liquidatedTile size: whale money
How to read this
Shows: every market where tracked whales hold $1M or more: the whale money in it, the side most of it is on, how far the price moved and how much whale money was forced out by liquidation.
Read it: Big tiles are where whales hold the most. Green means most of the whale money in that market is long, red short, and the colour grows stronger with that share. Under 53% whales are split and the tile stays grey. “Price move” colours by the size of the move instead, the arrow says up or down. Each block missing from a tile’s lower edge is whale money liquidated there, red for shorts, green for longs. Point at a tile or tap it for its figures.
Won’t show: why prices moved, or whether whales are right.
About the data: A past day shows its close at 00:00 UTC. The whales’ lean and the money close to liquidation are live only, so a past day leaves them out.
Markets by whale money
- BTC4.1%$1.74B
- ETH4.5%$1.55B
- HYPE10.4%$886M
- ZEC6.8%$399M
- SOL6.6%$273M
- S&P 5000.63%$166M
- GOOGL4.1%$139M
- XYZ1001.9%$138M
- GOLD1.2%$128M
- SKHX3.9%$119M
- NEAR14.3%$113M
- WTI0.96%$112M
- BRENTOIL1.00%$105M
- XRP6.7%$98.3M
- SILVER3.7%$77M
- SPCX2.3%$76.7M
- META0.75%$73.5M
- SNDK6.2%$64.3M
- SKHY3.2%$60.2M
- AAPL1.9%$51.5M
- DOGE5.8%$43.5M
- PUMP13.1%$41.1M
- INTC23.7%$37.8M
- CRCL6.0%$37.5M
- ANTH–$36.6M
- LIT8.0%$35M
- XMR1.1%$34.5M
- DRAM5.8%$34.5M
- ENA16.4%$31.1M
- VVV8.1%$30M
- MU5.8%$26.3M
- XPL5.5%$23.9M
- UNI10.9%$23.4M
- WLD12.7%$23.2M
- BNB8.2%$21.5M
- CXMT6.4%$21.3M
- ZRO10.6%$20.1M
- SMSN7.5%$18.2M
- LINK10.4%$18M
- AAVE11.0%$17.1M
- kPEPE9.6%$15.7M
- JPY0.01%$15.5M
- NVDA1.8%$15.5M
- MRNA3.3%$13.2M
- NBIS6.7%$12.2M
- STRK10.1%$12M
- GRASS14.5%$10.8M
- ANT5.1%$10.1M
- ADA7.7%$10.1M
- EUR0.23%$10M
- ZHIPU11.3%$7.7M
- MSTR7.4%$7.4M
- GRAM6.6%$7.2M
- CASHCAT12.6%$6.8M
- SUI7.8%$6.6M
- FARTCOIN10.8%$6.5M
- TSLA1.3%$6.4M
- PONS21.1%$6.1M
- MON11.0%$6M
- AMD6.8%$6M
- CBRS0.25%$5.7M
- ORCL4.3%$5.2M
- SOXL12.4%$5M
- AERO10.6%$4.8M
- PAXG1.0%$4.7M
- TRX7.4%$4.4M
- TAO9.1%$4.3M
- HOOD3.1%$4.3M
- ASTER2.8%$4.1M
- CRWV5.6%$4M
- LTC7.4%$4M
- PURRDAT13.9%$3.4M
- AMZN10.9%$3.3M
- NBIS–$3.2M
- AVAX8.1%$2.7M
- EWY3.8%$2.7M
- MSFT3.2%$2.7M
- TSM2.7%$2.6M
- PURR15.0%$2.6M
- AVGO2.5%$2.3M
- UNITREE0.18%$2.1M
- TLT0.81%$2M
- EWZ1.7%$1.9M
- MEGA9.1%$1.8M
- DELL8.5%$1.8M
- WLFI2.2%$1.8M
- FET11.6%$1.8M
- FIL9.8%$1.7M
- ONDO9.9%$1.5M
- NATGAS3.9%$1.5M
- PLATINUM3.9%$1.4M
- kBONK11.8%$1.4M
- CHIP12.7%$1.3M
- MNT7.5%$1.2M
- WIF9.7%$1.2M
- TRUMP10.1%$1.1M
- LITE11.1%$1.1M
- COIN4.6%$1.1M
- BABA2.0%$1M
- CC6.2%$1M
- BB4.4%$1M
- NFLX0.19%$1M
On 29 Oct
Longs pay shorts in 72 markets, shorts pay longs in 16. Across Hyperliquid, $252M was liquidated on 29 Oct, 88% of it longs.
The cascade ran from 20:00 to 21:00 UTC: $163M liquidated across Hyperliquid, $14.5M of it tracked whales, mostly longs.
It began in CRWV at 20:04, then INTC at 20:12, ETH at 20:42, BTC at 20:50. Across Hyperliquid it reached 217 more markets.
A tracked whale liquidated, size is the moneyAcross Hyperliquid, by the hour: longs above the line, shorts belowThe cascade: the hours with at least a fifth of the peak hour’s moneyUTC
29 Oct in 15 seconds
The map fills hour by hour as whales are liquidated, with the count and the clock. Made for posts and news pages: no sound needed, the source in the picture.
The heatmap of 29 Oct in one picture
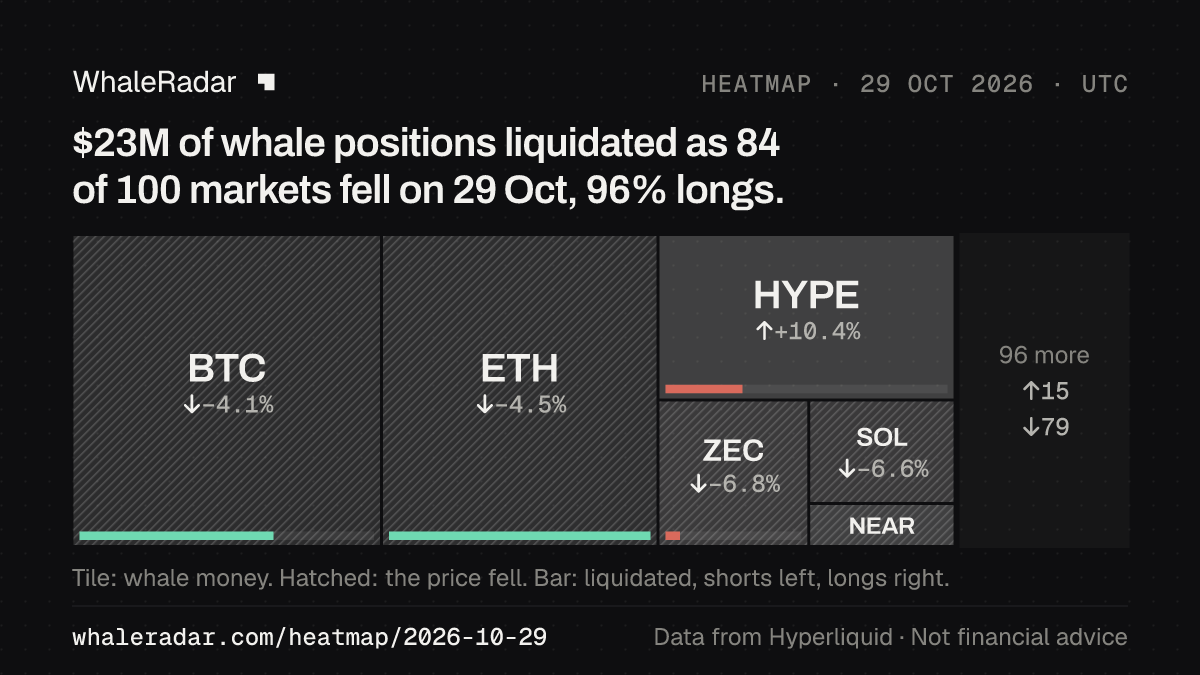
Every market by its whale money, its price move and what was liquidated.

For articles and reports
Every market with the liquidations by the hour, ready for your story.
Light or dark, in five formats from 16:9 to stories. The source and the time of the data are part of the picture. Free to publish with that credit line.


How to read this page
- Tile
- A market where tracked whales hold $1M or more. Its size is that whale money, its number the price move.
- Group
- Crypto is one group. Every other market sits in its sector, as on Markets: tech, semiconductors, energy, metals, indices, FX, pre-IPO and more. A group’s name opens its markets on All markets.
- Bar
- Whale money forced out by liquidation, every tracked liquidation of $100K or more, a partial one with its part.
- Across Hyperliquid
- Every account’s liquidations, from the Hyperliquid blockchain, by the hour.
The UTC day 29 Oct. From the Hyperliquid blockchain. Not financial advice.