BABA
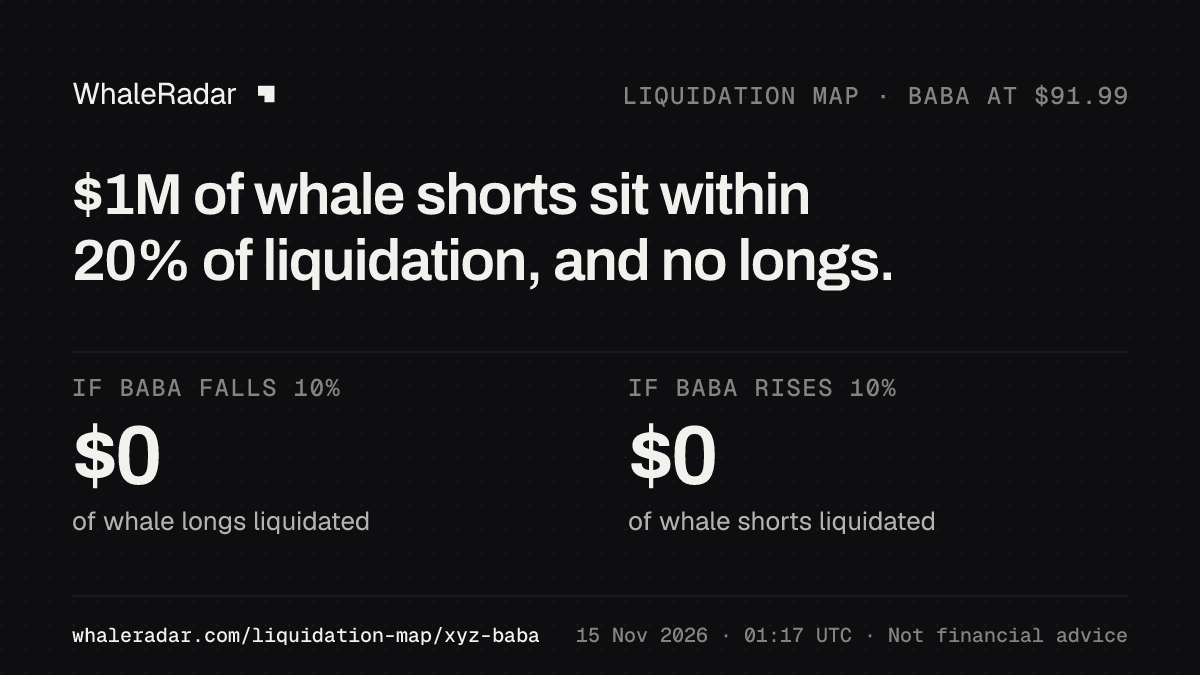
BABA liquidation map: $1M of whale shorts sit within 20% of liquidation, and no longs.
Within 20%, a rise would force out more whale money than a fall.
Longs below the price
- within 5% of liquidation
- $0
- within 10%
- $0
Shorts above the price
- within 5% of liquidation
- $0
- within 10%
- $0
On the map
- A $1M short, 19.2% above the price. No position of $10M or more is within 10%.
- $109.64
- whale positions on the map, of 2 in BABA
- 1
1 more above +20%: $1M, the nearest at +43.3%
Point at a price, tap it or use the arrow keys to see what would be forced out between the price and that level, and whose it is.
One whale position at its liquidation price: length is its money, strength its track recordMoney from the price outward, its own scaleThe price nowLongShort
How to read this
Shows: every BABA position of $1M or more held by a tracked whale, at the price where Hyperliquid would liquidate it, within 20% of the price.
Read it: Shorts sit above the price line, longs below it. The longer a bar, the more money would be forced out there. The line on the right adds it up from the price outward.
Won’t show: a level after the whale adds margin or changes leverage. Both move it.
About the data: A cross-margin position’s liquidation price moves with the rest of its account, and large positions are closed in steps, not at once.
By distance and side BABA · whale money by distance to liquidation
| Shortsabove the price | Distance | Longsbelow the price |
|---|---|---|
| – | Under 1% | – |
| – | 1–3% | – |
| – | 3–5% | – |
| – | 5–10% | – |
| $1M | 10–20% | – |
| 1 | Positions on the map | 0 |
| 10× | Average leverage | – |
| 10× | 90% of the money at or below | – |
Leverage as each whale set it on Hyperliquid, weighted by money. Distances at the price now.
Liquidation heatmap: how the walls moved BABA · the largest positions, up to 7 days, every 4 hours
30 days of the heatmap come with Pro, a bar every 12 hours. What Pro adds
No wall history for BABA yet.
Shade: distance to the price, stronger is closer (under 2%, 5%, 10%, 15%, beyond)A bar every 4 hours, as tall as the position’s money against its own largestClosed or liquidated
How to read this
Shows: the liquidation prices of the largest BABA whale positions over the last 7 days, one row per position, with the BABA price in the middle.
Read it: A stronger shade means the liquidation price sat closer to the price at that time. A wall comes closer when the price moves toward it, when its whale adds size or when the account loses elsewhere. It moves out when the whale adds margin.
Won’t show: positions below $1M and wallets we do not track.
Closest to liquidation BABA · within 20% · closest first
- 1Still Cachalotrecord 78 · Directionalshort$1M · 10×$109.6419.2%
BABA whale positionsWho was liquidatedNear liquidation in every market
How do you read the BABA liquidation map and heatmap?
Real positions, not a model.
Why are shorts above the price and longs below?
A short is liquidated when the price rises to its level, so shorts sit above the price line. A long is liquidated when the price falls to its level, so longs sit below it. The further from the line, the larger the move it would take.
What is one block?
Every block is one whale position at its liquidation price. Its length is its money, on one scale for the market, and its strength is the whale’s track record. Positions in the same half percent stand side by side, the largest first.
What is a liquidation wall?
Much whale money at one price, from one whale or more. Here it is simply a long row of blocks, named with its largest whale.
What does the running total show?
The column on the right adds up the whale money from the price outward, band by band, on its own scale. Where it climbs steeply, much money sits close together. Its marks at 5% and 10% are the figures above.
How do you read the liquidation heatmap?
Each row is one of the largest whale positions, shorts above the price line and longs below it. A bar every 4 hours shows where its liquidation price stood: the stronger the shade, the closer it was to the price, and the taller the bar, the more money it held against its own largest.
Why does a wall move?
A wall comes closer when the price moves toward it, when its whale adds size or when the account loses elsewhere. It moves further out when the whale adds margin or cuts the position.
What does the BABA liquidation map count, and what not?
Which positions are on the map?
Positions of $1M or more held by the tracked whales, the largest and most active wallets on Hyperliquid, each at the liquidation price Hyperliquid reports for it. Each level is current to the time shown and moves when a whale adds margin, resizes or closes.
Does it show the whole market?
The map shows the tracked whales, not the market’s whole open interest. Smaller accounts can add forced orders at the same levels.
Why does cross margin move a level?
Most large accounts use cross margin. Their liquidation price comes from the whole account, so a loss in another market moves it too.
Which price triggers a liquidation?
Hyperliquid liquidates on the mark price, which blends prices from large exchanges with its own book. The price line here is the live trading price for the eight headline markets, so the two can differ by a little.
Questions about the BABA liquidation map and heatmap
- Why only 20% either side of the price?
- A position further away needs a move of more than a fifth of the price to be liquidated. The radar and the market pages use the same range.
- Why do many whales have no liquidation price in range?
- Most large wallets use cross margin and little real leverage, so their liquidation price sits far away or nowhere. Few sit close to the price.
- What happens at a wall?
- If the price reaches it, the forced orders there add to the move: longs sell into a fall, shorts buy into a rise.
- Can a price be pushed to a wall?
- In a thin market large orders can move the price to where positions are liquidated, and that has happened on Hyperliquid. Its mark price follows prices on large exchanges, so the largest markets move less easily than thin ones.
- Why is a whale I know missing?
- The map shows positions of $1M or more whose liquidation price sits within 20% of the price. A position further away, or one with no liquidation price, is on the market page’s radar instead.
- Which markets are on the map?
- Every Hyperliquid market where tracked whales hold positions of $1M or more. The eight headline markets are the tabs, the others are in the list beside them.
- Is this a liquidation heatmap?
- Yes, one made of real positions. The liquidation heatmap on this page shows the largest whales’ liquidation prices over seven days, shaded stronger the closer each one sits to the price. Most liquidation heatmaps estimate where liquidations might sit from assumed leverage. This one shows the tracked whales’ real positions, each at the liquidation price Hyperliquid reports for it.
- Is this the same as the crypto heatmap?
- No. The crypto heatmap shows every market at once as a tile, sized by the whale money in it and shaded by its price move over 24 hours. This page shows one market’s liquidation prices.
Liquidations todayNear liquidationUnder waterCrypto heatmap: every marketGuide: liquidation wallsMethodology
Post the BABA map.
The finding and the money close to liquidation, in one picture.
How to read this map
- Within 5% and 10%
- Whale money whose liquidation price sits that close to the price now, the same measure as Near liquidation.
- A band
- Half a percent of the price wide. Hover or tap it for its whales.
As of Sun, 15 Nov 2026, 01:07 UTC. From the Hyperliquid blockchain. Not financial advice.