89track record
Short IBM $5.9M. Liquidation 14.9% away.
Entry $247.3price now −0.5%Unrealised PnL +$29KOpened6 NovLeverage5×Last moveNone in 24 hours
Directional · 74% confidenceFollow
The ReadIBM$246.1+0.07%Positions 3 min agoNew York closed until Mon 01:05 UTC: Whale Street
No liquidation wall stands out. The directional whales lean short. The rest of Hyperliquid leans short.
As of 15 Nov 2026, 01:07 UTC, tracked whales on Hyperliquid hold $6.3M long and $5.9M short in IBM: 51% long.
IBM alerts
Longs and shortsIBM
Whale longs in IBM entered at $247.4 on average, all of it at a loss. Whale shorts in IBM entered at $247.3 on average, none of that money at a loss.
| Shorts$5.9M | Longs$6.3M | |
|---|---|---|
| Positions | 1 | 1 |
| Average entry | $247.3 | $247.4 |
| Entry range | $247.3 | $247.4 |
| Average leverage | 5× | 3× |
| Liquidation within 20% | $282.8one position | none |
| At a loss now | 0% | 100% |
Longs on the right, shorts on the left. New at the top, older toward the bottom.
Arrow keys step through the positions, largest first. Escape closes.
Whale money · 2 wallets$12.2MLongs and shorts, every tracked wallet.
Share of open interest91%of all open IBM positions by value
Positions 3 min ago 2 whale positions 50% unclassified
The centre is today’s price. The closer a whale sits to it, the smaller the move that liquidates it.
Colour is the side, size is the money. Green is long, red is short. Stronger colour means a better track record.
Shaded edge: no liquidation price within ±20%.
Where whales gather: a wall. Many would be liquidated around the same price. The densest spot holds the most money.
Won’t show: what a whale holds on other exchanges. A short here can hedge a long somewhere else.
Over the month, whales gained share while the market grew. Longs pay shorts to stay open.
Pro draws 90 days and a year of daily closes. What Pro adds
Whale share
91%
of all open IBM positions by value, held by tracked whales
0% a month ago
Open interest
$13.4M
all open positions, longs and shorts together
+931% in 7 days
all positionstracked whales’ share
Funding
+16%a year
longs pay shorts
7-day average −4.7% a year
average over the range +5.1%
Over 30 days
Over the 25 days on record, funding moved about 0.32% of a position’s value from longs to shorts.
Shows: how much money is open in this market, the part tracked whales hold, and what holding a position costs or earns.
Read it: A growing whale share means whale money grows here faster than everyone else’s. Funding above zero means longs pay shorts every hour, because more money wants to be long.
Won’t show: open interest on other exchanges.
5 days in this range have no open interest on record. The lines break there.
As a group, whale longs are under water and whale shorts in profit.
PriceLongs’ average entryShorts’ average entryShaded: the side in profitBars: whale money by entry price, longs right, shorts left
Shows: where tracked whales got in against the price: each side’s average entry at every daily close, weighted by money, and today’s open positions as money by entry price.
Read it: Where the price runs above the green line, the whale longs as a group hold a paper profit and the gap is shaded green. Where it runs below the red line, the shorts do, shaded red. No shade: that side is under water. On the right each bar is the whale money that got in within one price band, longs to the right, shorts to the left. Bars under the price line are longs in profit and shorts at a loss. Point at a day for its close.
Won’t show: funding and fees, or the entry of positions closed before a close. The average moves when whales open, add or close, not with the price.
Within 20%, a rise would force out more whale money than a fall.
Point at a price, tap it or use the arrow keys to see what would be forced out between the price and that level, and whose it is.
One whale position at its liquidation price: length is its money, strength its track recordMoney from the price outward, its own scaleLongShort
Shows: where tracked whale positions would be forced out, 20% either side of the price, by the money at each level.
Read it: The longer a block, the more money would be forced out at that price. The nearer it sits to the price line, the smaller the move that reaches it.
Won’t show: a level after the whale adds margin or changes leverage. Both move it.
Moves on positions of $1M or more and every liquidation of $100K or more, 15 minutes after Pro.
Opened or addedClosed or trimmedLiquidatedLongShortDot size is the money, moves close together add up · Per hour · Moves on positions of $1M or more and every liquidation of $100K or more, 15 minutes after Pro
Shows: whale moves on the price at the moment they happened, and the same money added up per hour below.
Read it: A dot and its bar are the same money.
Won’t show: why a whale moved. A close can take a profit, cut a loss or end a hedge.
Largest realised gain and loss of a tracked whale in IBM on record: +$8K by Cold Octopus on , −$13K by Cold Octopus on .
Short$5.9M1 whale
Long$6.3M1 whale
Size, leverage and distance to liquidation of each position.
Among the twelve largest IBM positions right now, the four best track records. Open a whale for the details.
Short IBM $5.9M. Liquidation 14.9% away.
Long IBM $6.3M. No liquidation within 20%.
Free follows 3 whales with alerts. More stay in this browser, without alerts.
Free follows 3 whales and pods with alerts. More stay in this browser, without alerts.
Alert me on TelegramOr keep it on every device with an email link, no password:
A quiet day: no whale move of $1M or more. The radar still shows how the positions sat, hour by hour.
Now
01:07UTC · now
These 24 hours as a 15-second video
Shows: every hour of the last day as the Hyperliquid blockchain recorded it: whales appear, grow, shrink and leave as they did.
Read it: The radar and the readout follow the line under them. Pick a move in the list to jump to it.
Won’t show: why a whale moved.
Watch the last 7 days move by move, with the distance to liquidation
IBM right now, in one picture: where whales lean, what they hold and how far the price is from the largest whale liquidation within 20%.
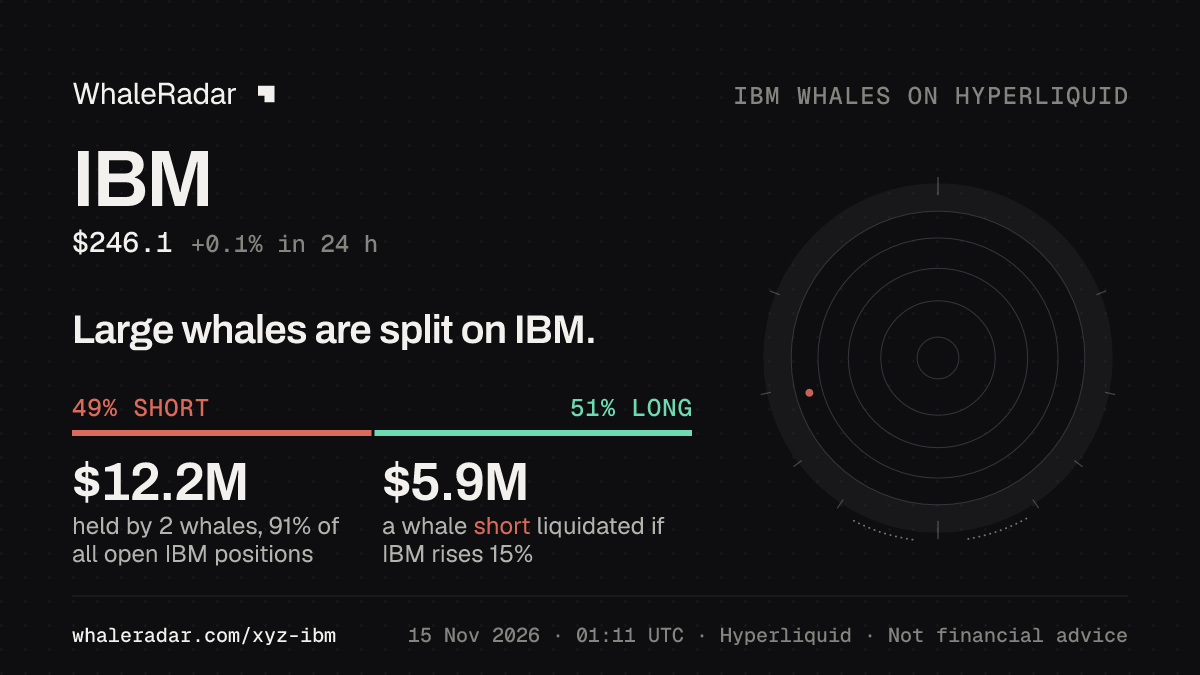
The card shows where IBM whales stand now, with the time and the source.

For articles and reports
Light or dark, in five formats from 16:9 to stories. The source and the time of the data are part of the picture. Free to publish with that credit line.
A short message when a wall forms near the IBM price, when a whale you follow moves, and the IBM read once a day.
Opens Telegram. Free, no sign-up.
Pro sends these alerts as the whale surfaces, 15 minutes before Free. What Pro adds
IBM on Hyperliquid is a perpetual on the share of IBM, the computing company listed on the New York Stock Exchange.
It trades around the clock, also while its home exchange is closed, so its price at night and over the weekend shows where traders expect the share to open.
It is a contract on a price, margined in USDC. It gives no claim on shares and is not offered or endorsed by the company.
As of Sun, 15 Nov 2026, 01:07 UTC. WhaleRadar tracks 1,439 of the largest and most active accounts on Hyperliquid. 2 of them hold IBM positions of $1M or more, 91% of all open IBM positions by value. Positions, prices and liquidation prices from the Hyperliquid blockchain. Not financial advice.
MarketsWhere whale money sits in each market, live.

