Whale Flowsclosedto the close of 31 Oct
October 2026 on Hyperliquid: whale money fell 17% and ended leaning short
Tracked whales held $8.68B on Hyperliquid at the close of 30 Sep and $7.19B at the close of 31 Oct. The Whale Tide went from 26 to 29, with a low of 24 on 12 Oct and a high of 29 on 25 Oct.
01Whale money
$7.19B
−17% in the month
Tracked whales held $7.19B on Hyperliquid at the close of October 2026, 17% less than a month earlier.
02Net flow
$346M
net toward shorts · from 23 Oct
From 23 Oct to the close of October 2026, tracked whales on Hyperliquid moved $6.91B toward longs and $7.25B toward shorts, net $346M toward shorts.
04Records of 80+
13% long
the rest 61% long
At the close of October 2026, tracked whales with a track record of 80 or more held $2.85B on Hyperliquid, 13% of it long, against 61% long for those below 80.
Whale money at each close
Whale Tide at each close
Where the money went
Whale money grew most in HYPE (+$209M). It shrank most in ETH (−$825M). At the close, 76% of whale money sat in crypto.
Grew most
- HYPE$730M → $939M+$209M
- BTC$1.52B → $1.61B+$85M
- GOOGL$59.8M → $131M+$71.7M
- BRENTOIL$35.5M → $95.3M+$59.7M
- ANTH$0 → $37.8M+$37.8M
Shrank most
- ETH$2.32B → $1.49B−$825M
- PUMP$181M → $49M−$132M
- SOL$389M → $280M−$109M
- NVDA$109M → $13.1M−$95.5M
- XRP$157M → $70.7M−$86.5M
By class
- Crypto$6.71B → $5.43B76%Tide 23 → 26
- Stocks$1.21B → $953M13%Tide 39 → 34
- Indices$246M → $292M4%Tide 50 → 48
- Metals$288M → $246M3%Tide 33 → 25
- Energy$105M → $199M3%Tide 43 → 63
- ETFs$103M → $46.7M1%
- FX$20.5M → $25.6M0%
Whale money is the tracked wallets’ positions of $1M or more, both sides, at the daily close. It changes when whales open, add, cut or close, and when prices move.
Moves toward long and short
From 23 Oct to the close of October 2026, tracked whales on Hyperliquid moved $6.91B toward longs and $7.25B toward shorts, net $346M toward shorts. Whales with a record of 80 or more moved a net $49.7M toward longs, those below 80 a net $395M toward shorts.
| Class | Toward longs | Toward shorts | Net |
|---|---|---|---|
| Crypto | $5.92B | $6.26B | $338M short |
| Stocks | $502M | $511M | $8.6M short |
| Energy | $200M | $184M | $16.4M long |
| ETFs | $128M | $139M | $10.9M short |
| Indices | $87.6M | $95.9M | $8.3M short |
| Metals | $70.6M | $66.6M | $3.9M long |
5,291 moves on whale positions, counted when they happened, not where the money stands. How this is counted
Who held the money at the close
At the close of October 2026, tracked whales with a track record of 80 or more held $2.85B on Hyperliquid, 13% of it long, against 61% long for those below 80.
| Group | Wallets | Long | Short | Long share |
|---|---|---|---|---|
| By track record | ||||
| Record 80+ | 89 | $380M | $2.47B | 13% |
| Record 50–79 | 215 | $1.17B | $1.58B | 43% |
| Under 50 | 112 | $1.46B | $135M | 92% |
| By label | ||||
| Directional | 373 | $2.63B | $3.69B | 42% |
| Hedger | 18 | $188M | $182M | 51% |
| Market Maker | 1 | $4.4M | $0 | 100% |
| Unclassified | 24 | $185M | $308M | 38% |
| By size | ||||
| $100M or more | 10 | $94.9M | $2.14B | 4% |
| $10M to $100M | 146 | $2.34B | $1.57B | 60% |
| $1M to $10M | 260 | $573M | $474M | 55% |
| All tracked whales | 416 | $3.01B | $4.18B | 42% |
Every tracked wallet with positions of $1M or more at the close of 31 Oct, counted once in each group. The close a month earlier is not on record for this table. How this is counted
How often the lean was right
Whales leaned one way at 1,005 daily closes across the markets this month. By the next close the price had moved their way 536 times and the other way 430 times, and 39 closes ended flat. Right on 55% of the closes that moved.
- BTC12 right, 14 wrong46%
- ETH14 right, 12 wrong54%
- HYPE15 right, 12 wrong56%
- SOL16 right, 10 wrong62%
- GOLD4 right, 2 wrong–
- WTI1 right, 3 wrong–
- S&P 5002 right, 2 wrong–
- NVDA4 right, 2 wrong–
A lean is right when the price moved its way by more than 0.1% by the next daily close. Every market on the scorecard
The largest realised results
Gains
- Patient CurrentBTC long, $62.4M+$15.8M30 Oct
- Patient CurrentETH long, $17.6M+$4.7M30 Oct
- Quiet MantaNEAR long, $19.8M+$3.4M11 Oct
- Upper MeridianBTC long, $10.4M+$2.6M30 Oct
- Arctic FathomPONS short, $3M+$2.2M12 Oct
Losses
- Pale NarwhalPURRDAT long, $8.5M−$2.3M22 Oct
- Placid GyrePUMP long, $6.3M−$1.7M15 Oct
- Arctic CapeBTC long, $75.2M−$1.7M26 Oct
- Arctic CapeBTC long, $55.1M−$1.7M29 Oct
- Shaded CormorantXRP long, $15.1M−$1.5M29 Oct
Closed positions of tracked wallets, each counted over the whole position: its largest size and the result of every cut and the close.
How the whales did
645 tracked whales closed at least one position of $100K or more this month. Summed per wallet, 353 ended the month in profit and 290 at a loss, before fees and funding.
October 2026
55%353 of 645 whales ended in profit, 290 at a loss
- Median result
- +$3K
- Liquidated at least once
- 11% of them
Wallets that lost and stopped trading leave the list, so the share in profit can read high. 30 and 90 days on the scorecard
Realised gains and losses, day by day
Closed positions of tracked whales realised +$162M in gains and −$143M in losses this month, before fees and funding. The best day on balance was 30 Oct, the worst 22 Oct.
gains of positions closed in profitlosses of positions closed at a loss
| Day | Gains | Losses | Closed positions |
|---|---|---|---|
| 1 Oct | +$2.6M | −$1.9M | 248 |
| 2 Oct | +$5.3M | −$4.4M | 296 |
| 3 Oct | +$3.7M | −$971K | 79 |
| 4 Oct | +$1.6M | −$761K | 80 |
| 5 Oct | +$2M | −$2.2M | 231 |
| 6 Oct | +$1.7M | −$2.4M | 148 |
| 7 Oct | +$5.2M | −$9.6M | 271 |
| 8 Oct | +$7.4M | −$7.8M | 413 |
| 9 Oct | +$2.8M | −$1.7M | 217 |
| 10 Oct | +$511K | −$568K | 130 |
| 11 Oct | +$6.1M | −$466K | 160 |
| 12 Oct | +$6M | −$3.2M | 333 |
| 13 Oct | +$3.9M | −$4.2M | 354 |
| 14 Oct | +$6M | −$6.6M | 368 |
| 15 Oct | +$9.2M | −$13.3M | 567 |
| 16 Oct | +$3.1M | −$2.4M | 459 |
| 17 Oct | +$2.1M | −$1.7M | 169 |
| 18 Oct | +$2M | −$3M | 251 |
| 19 Oct | +$3.4M | −$5M | 426 |
| 20 Oct | +$4M | −$4.2M | 460 |
| 21 Oct | +$7M | −$2.8M | 475 |
| 22 Oct | +$4.5M | −$9.7M | 597 |
| 23 Oct | +$3.3M | −$4.8M | 457 |
| 24 Oct | +$3.3M | −$4.7M | 290 |
| 25 Oct | +$1.7M | −$2.6M | 182 |
| 26 Oct | +$2.9M | −$5.1M | 321 |
| 27 Oct | +$1.8M | −$2M | 277 |
| 28 Oct | +$4.9M | −$3.9M | 383 |
| 29 Oct | +$19.2M | −$16M | 813 |
| 30 Oct | +$32.9M | −$13.1M | 627 |
| 31 Oct | +$1.8M | −$2.1M | 151 |
Each closed position counts on the day it closed, with its result over the whole position.
Liquidations
Across every account on Hyperliquid, $2.42B of positions were liquidated this month, 80% of it longs.
The largest among tracked whales, by position size
- Breezy SounderBTC short$37.6M30 Oct
- Breezy SounderBTC short$31.3M28 Oct
- Breezy SounderBTC short$28.4M26 Oct
- Southern MantaETH long$24.1M7 Oct
- Breezy SounderBTC short$22.8M21 Oct
Hyperliquid in the month
Open interest on Hyperliquid stood at $14.84B at the close of October 2026, 11% less than a month earlier, and tracked whales held 48% of it. From 12 Oct to the close of October 2026, Hyperliquid's Assistance Fund bought 431,022 HYPE for $35.2M.
| Figure | October 2026 | September 2026 |
|---|---|---|
| Open interest at the close | $14.84B | $16.59B |
| Held by tracked whales | 48% | 52% |
| Trading volume | $57.76B26 Oct to 31 Oct | – |
| Liquidated, every account | $2.42B | $1.76B |
| Liquidated, tracked whales | $476M | $264M |
| HYPE bought by the Assistance Fund | 431,022 HYPEfrom 12 Oct | – |
| Paid by the Assistance Fund | $35.2Mfrom 12 Oct | – |
| HYPE held by the fund at the close | 48.40M HYPE | – |
| Whale Tide at the close | 29 | 26 |
The Assistance Fund is Hyperliquid’s own fund. It buys HYPE with the exchange’s income, in small orders through the day. Its trades before 12 Oct are not part of this count. Its wallet on the explorer How this is counted
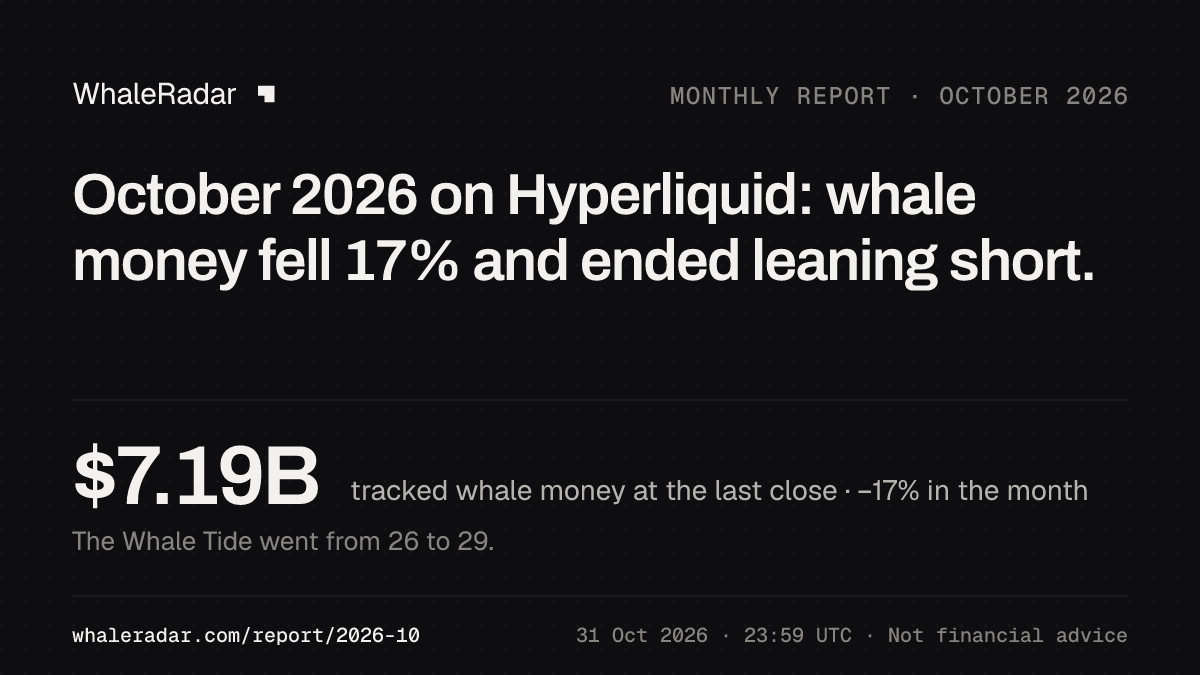
The month in one picture: the headline and its figures.
How this is counted
- Whale money
- The positions of tracked wallets of $1M or more, longs and shorts together, at the daily close (00:00 UTC). It changes when whales open, add, cut or close, and when prices move. A month earlier means the last close of the month before.
- Net flow
- Every recorded move on a whale position of $1M or more, before or after the move. Opening or adding to a long and cutting or closing a short count toward longs, the reverse toward shorts, a flip both. Net flow is the difference. It shows where whales moved money, not where it stands, and a price move alone does not count. Moves are on record from 23 Oct.
- In TradFi markets
- The share of whale money at the close in stocks, indices, commodities, FX and ETFs on Hyperliquid: everything but crypto.
- Records of 80+
- The track record is a score from 0 to 100 from a wallet’s returns on Hyperliquid, all time, the last month and the last week, and how steady they were over the last year. The tile shows the long part of the whale money of wallets with 80 or more at the close, against those from 1 to 79. Wallets without a record yet count in neither.
- Who held the money
- Each tracked wallet with positions of $1M or more at the close counts once in each group: by its track record, by its label (an estimate from how it trades) and by the size of its whale money across markets. A wallet with longs and shorts adds to both columns.
- Hyperliquid in the month
- Open interest is the value of every open position in Hyperliquid’s perpetual markets at the close, as the exchange reports it. Trading volume is the traded value of those markets, day by day. Liquidations count every account. The Assistance Fund’s figures are its own trades of HYPE against USDC. A figure that covers only part of a month names its days.
Every report figure in the methodology
The month’s tables as CSV: Days, Markets, Who held the money, Hyperliquid in the month. Free to use under CC BY 4.0, with the credit “Source: WhaleRadar” and a link to this report.
Every day of the month
From the Hyperliquid blockchain, at each daily close (00:00 UTC). Whale money and the Tide count tracked wallets with positions of $1M or more. Liquidations count every account on Hyperliquid. Not financial advice.